Dublin Analytical Education
DLS Instrument Settings, Limitations, Sample Preparation and Data Interpretation
In Summary
Meaningful DLS results depend on selecting appropriate instrument settings, understanding size and concentration limits, preparing samples carefully and interpreting polydispersity and distribution data.
Which scattering angle and laser wavelength should I choose?
DLS systems typically offer back‑scatter (≈170°), side‑scatter (90°) and forward‑scatter (≈17°) configurations. Back‑scatter minimises multiple scattering in concentrated or absorbing samples; side‑scatter reduces reflections and is well suited for molecular weight measurements; forward‑scatter is used for electrophoretic light scattering and zeta potential measurements.
Most instruments use 635 nm lasers for stability, but 532 nm or 785 nm alternatives reduce fluorescence or absorption.
A good rule of thumb is to remember that nano materials between 0.5 – 250nm work well with back-scatter(≈170°). This crosses over with side‑scatter (90°), which is well suited for materials with a size range of up to 900nm. When you get into the micron range, forward‑scatter (≈17°) works we up to around 10 microns for DLS.
How long should a DLS measurement take and what are the limits?
Measurement times range from a few seconds for quick checks to hours for kinetic studies. DLS typically measures particles between 1 nm and ~5–10 µm. Below 1 nm the scattering cross‑section is too small; above several microns sedimentation and multiple scattering degrade accuracy. Concentration limits range from 10⁻⁶ % for dilute latex standards up to ~30 % for micelle suspensions, depending on particle type and measurement head.
Do I need calibration and special cuvettes?
DLS is inherently calibration‑free. Nevertheless, it is good practice to verify instrument performance with certified latex standards (e.g., 100 nm latex).
Standard 10×10 mm cuvettes work for most samples, but specialised vials, capillaries and syringes are available to accommodate small volumes or high‑throughput workflows.
How do I prepare samples and remove contaminants?
Accurate results require clean, dust‑free samples. Use filtration or centrifugation to remove dust and aggregates before measurement. Ensure the sample is homogeneous, avoid bubbles and allow temperature equilibration. Disposable cuvettes prevent cross‑contamination; thorough cleaning is essential when using reusable cells.
How do solvent and temperature affect DLS measurements?
Particle size calculation uses the solvent’s refractive index and viscosity. Viscosity depends on temperature, so the instrument must accurately measure or control temperature and adjust for solvent properties. Automatic viscosity correction (e.g., in the NanoKin software) ensures accurate hydrodynamic radius values under varying conditions.
What is the polydispersity index (PDI) and which distribution should I report?
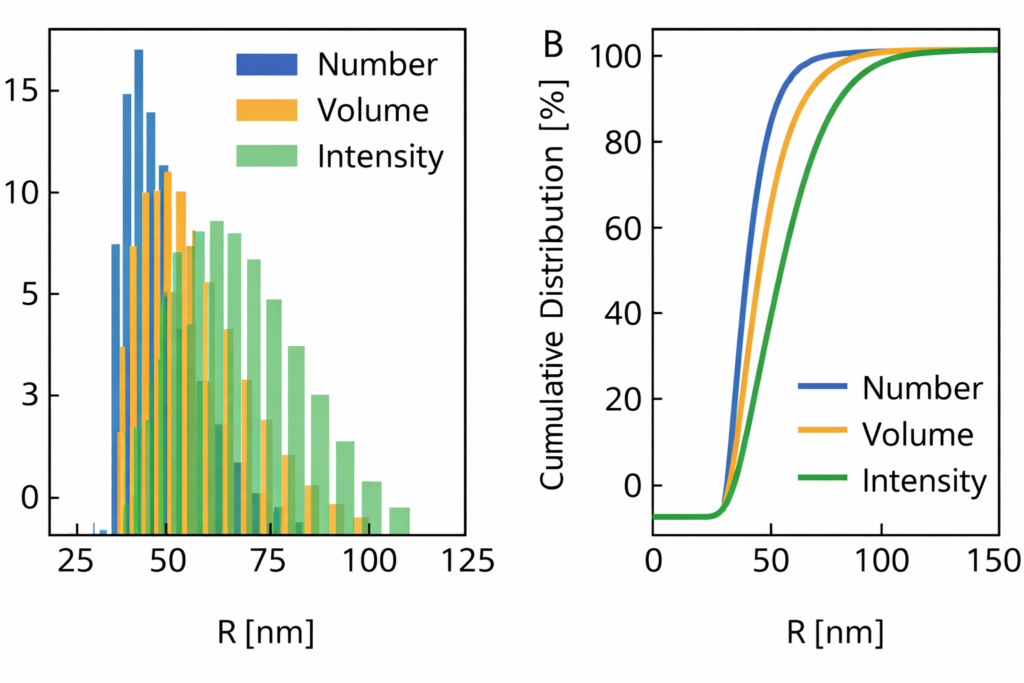
The PDI quantifies distribution breadth. Values below 0.1 indicate monodisperse samples; values above 0.2 suggest broad or multi‑modal distributions. DLS software generates intensity, volume and number distributions. Only the intensity distribution comes directly from the measurement and is considered most reliable. Converting to volume or number distributions involves modelling assumptions that can amplify error.
How accurate and reproducible is DLS?
High‑quality instruments achieve reproducibility of around ±5 % on standard samples; Cordouan’s VASCO Kin claims better than ±1 % reproducibility. Resolution is limited by the inversion algorithm: distinct populations must differ by approximately a factor of two in diameter to be resolved.
What to do Next?
Proper instrument settings, clean samples and correct data interpretation are essential for reliable DLS measurements. Our specialists can help you optimise angles, wavelengths, sample preparation and data analysis for your specific application. To see how VASCO Kin simplifies these tasks with automatic viscosity correction and advanced algorithms, talk to our experts.
Page FAQ's
Backscatter is best for concentrated samples, while 90° is typically used for standard measurements.
DLS can measure particles from approximately 1 nm up to several micrometres.
No, but performance can be verified using standard reference materials.
PDI indicates how broad the particle size distribution is, with lower values meaning more uniform samples.
The intensity distribution is the most reliable as it is directly measured.
Contact Us Today
We take great pleasure in assisting you and ensuring you get a prompt response to your questions
Live chat opening hours Mon – Fri 9:15 to 16:30 (UK Time)