
SciMed Education
Testing Lithium-Ion Batteries
In Summary
Lithium-ion batteries are at the heart of modern energy storage—from portable electronics and electric vehicles to renewable energy systems and large-scale grid storage. Understanding how batteries perform, age, and fail is critical for researchers, manufacturers, and quality control teams. Here we explain the basics of a lithium ion coin cell and detail a few of the standard test protocols you can run on a Gamry potentiostat to learn more about batteries.
Electrochemical testing provides the data needed to evaluate battery capacity, charge/discharge efficiency, cycle life, self-discharge, leakage current, and impedance behavior.
1. Understanding Lithium-Ion Battery Structure
A typical lithium-ion battery consists of:
Anode – typically graphite on copper foil
• Cathode – usually lithium transition-metal oxides on aluminum foil
• Electrolyte – enables lithium-ion transport between electrodes. Can be liquid, solid or polymeric.
• Separator – an ion-permeable membrane that prevents short circuits
Figure 1 shows a typical setup of a lithium-ion battery and outlines the electrochemical process during discharging.
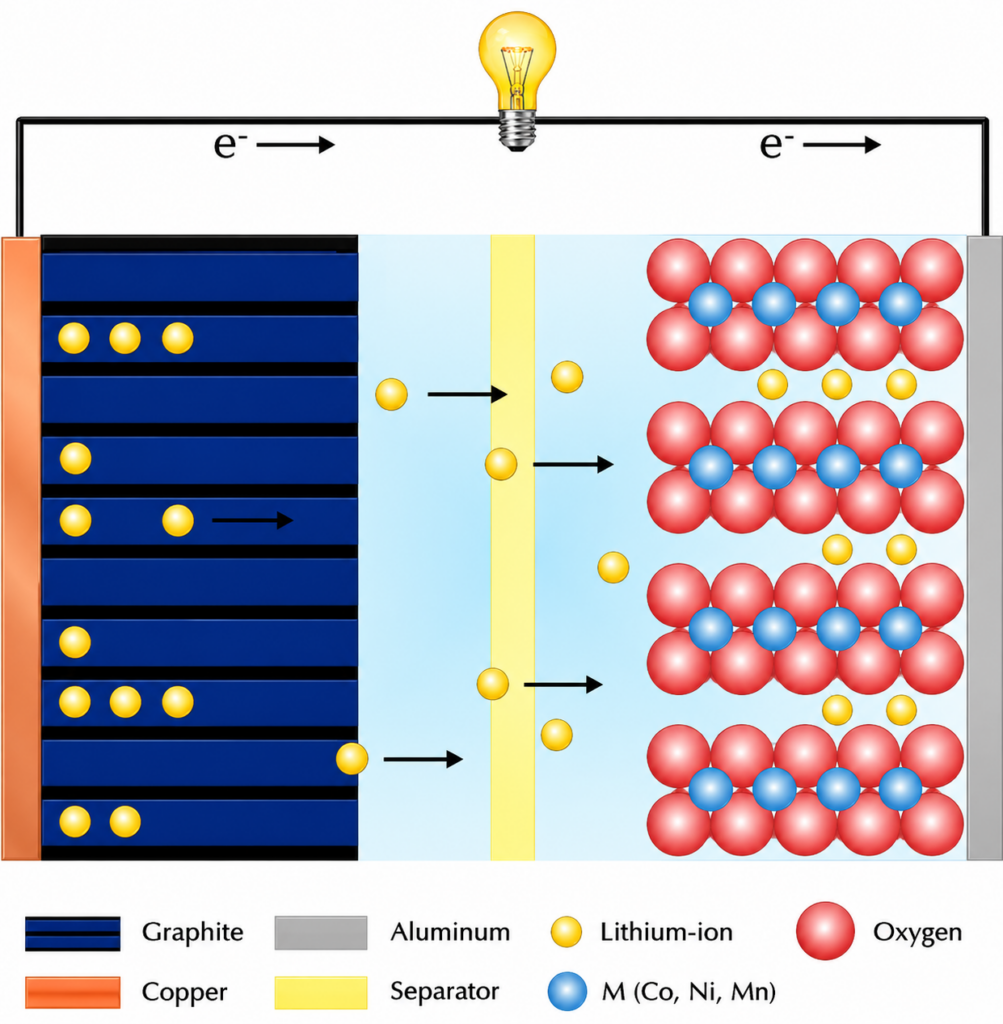
Figure 1 – Simplified diagram of a lithium-ion battery during discharging.
2. Charge and Discharge Curve Analysis
Charge/discharge testing is one of the most common tests run on batteries. It allows scientists to determine:
• usable capacity
• state of charge (SOC)
• depth of discharge (DOD)
• voltage stability
• efficiency of energy transfer
The initial voltage drop during discharge (IR drop) is directly related to Equivalent Series Resistance (ESR).
Figure 2 shows a typical charge (green) and discharge curve (blue) of a coin cell. Voltage (darker colored) and current (lighter colored) are plotted versus time. The cell was charged and discharged with a current of ±40 mA between 2.75 V and 4.2 V.
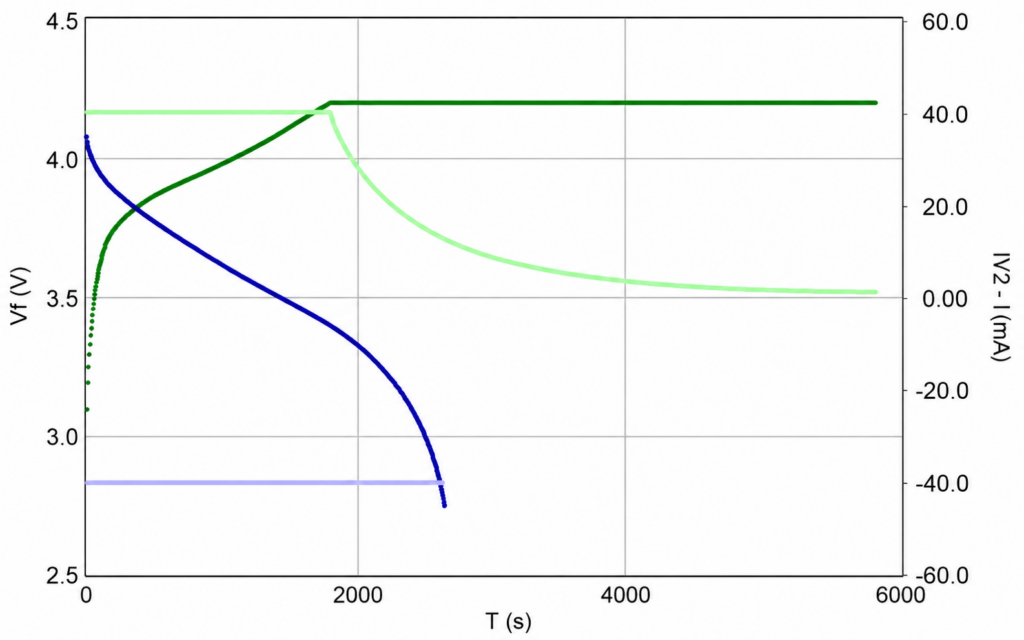
Figure 2 – Charge and discharge curve of a coin cell. (Dark Green) charging, (Dark Blue) discharging.
Voltage increases steadily while charging the battery. During this step, lithium-ions are extracted from the cathode and intercalate into the anode’s graphite layers. The cell is potentiostatically held at 4.2 V after reachingthe upper voltage limit. This step lasts until the current reaches 0.4 mA which corresponds to a C-rate of 0.01.
This ensures that the battery is fully charged. The battery’s state-of-charge (SOC) is 100 %. The voltage initially drops at the beginning of the discharge step. According to Ohm’s law, this voltage
drop ΔU (also called “IR-drop”) is directly proportional to the Equivalent Series Resistance (ESR), giving equation 1:
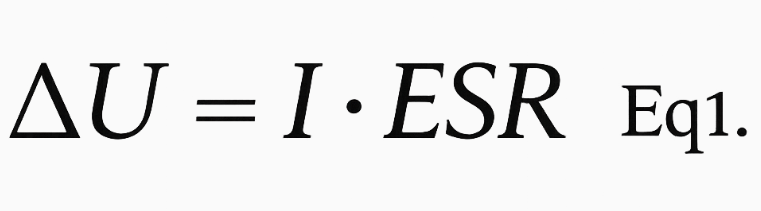
I is the applied current. The ESR sums up resistances from electrodes, electrolyte, and electrical contacts.
The lower the voltage drop ΔU the higher is the maximum output energy E that can be drawn from a battery, giving equation 2:
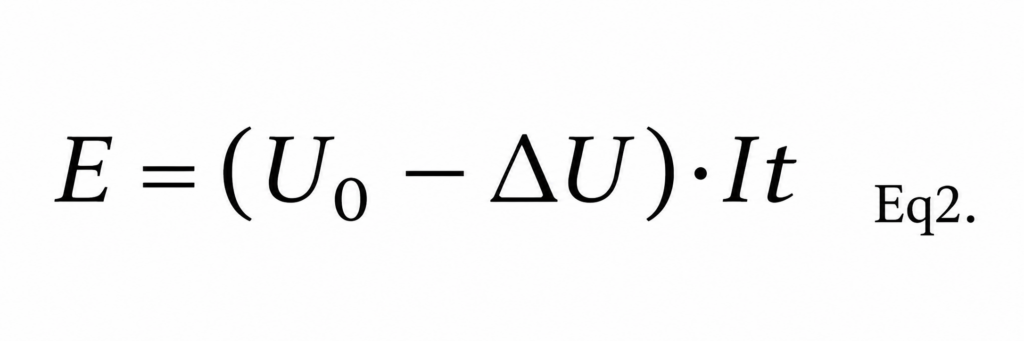
U0 is the actual voltage of the battery and t the charge or discharge time respectively.
The limit of a battery’s usable capacity is reached when the voltage declines sharply. The discharge step is stopped at 2.75 V. At this potential, the SOC is defined to be 0 %. The depth-of-discharge (DOD) is 100 %.
3. C-Rate Testing
The C-rate describes how quickly a battery is charged or discharged relative to its rated capacity.
Higher C-rates allow faster charging and faster energy delivery, but also increase:
• IR drop
• heat generation
• capacity loss
• long-term degradation
Figure 3 shows five discharge curves with increasing C-rates (from dark to light green). The battery’s potential is plotted versus capacity. It is automatically calculated by Gamry’s Echem Analyst.
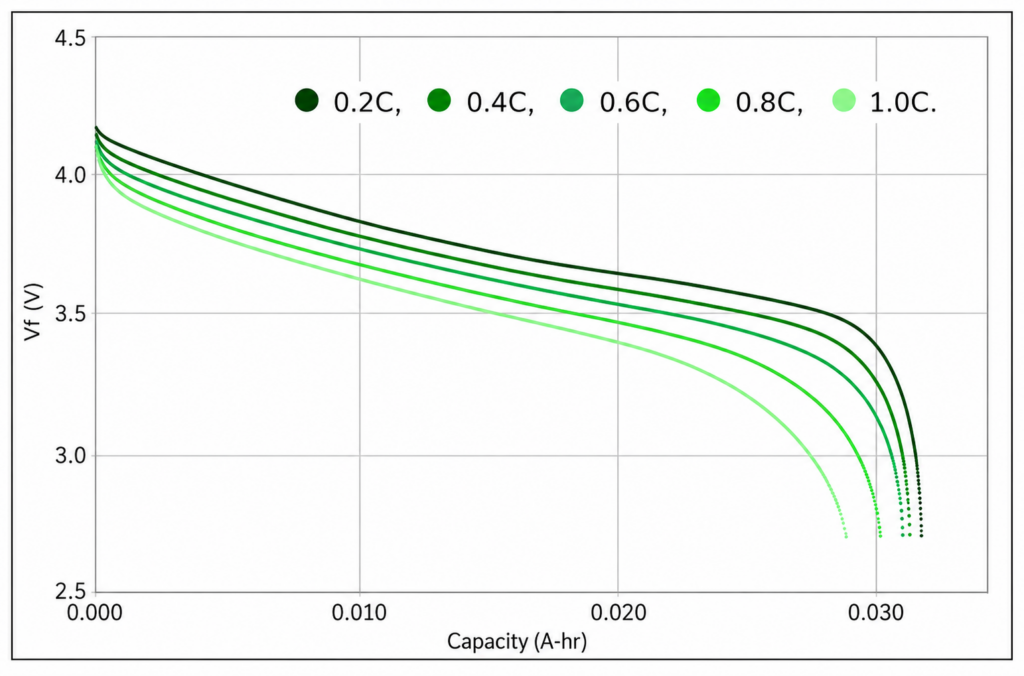
Figure 3 – Single discharge curves (voltage versus capacity) of a coin cell using different C-rates.
The coin cell was first charged to 4.2 V and held at this potential for a longer period to fully charge the battery. Afterwards, the battery was discharged to 2.75 V. The C-rate was varied between 0.2 C (8 mA) and 1.0 C (40 mA).
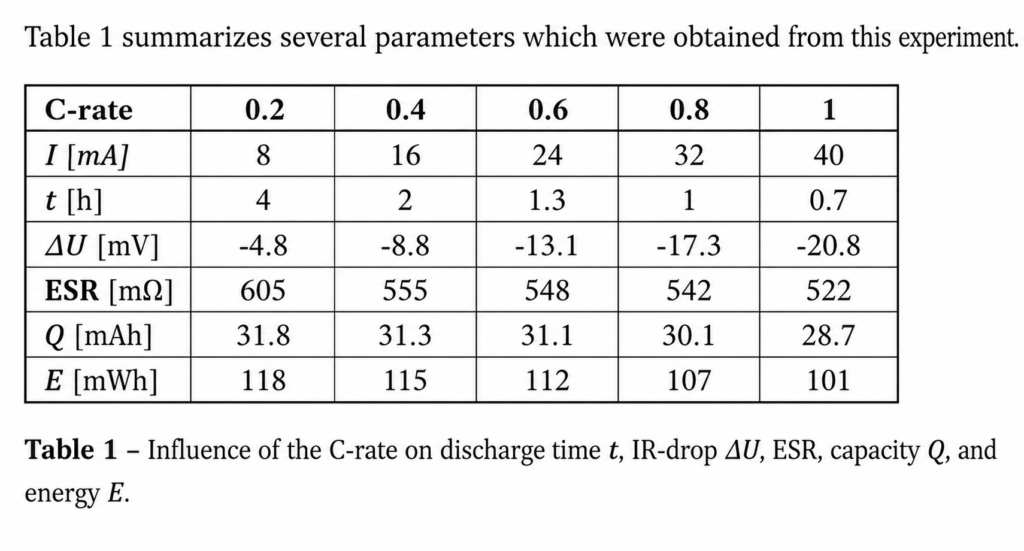
As mentioned before, discharge time t decreases with increasing C-rate. Note that t is shorter than the theoretical discharge time. These variations are mainly influenced by age and amount usage of a battery as well as temperature.
Increasing C-rates increase also the IR-drop. This affects negatively capacity and energy. Capacity is decreasing by about 10 % when increasing the C-rate from 0.2 C to 1.0 C.
Note also that the ESR is decreasing with higher C-rates. This can be explained by increasing temperatures within the battery. However, drawbacks like lower capacity and energy outweigh this advantage. In addition, higher temperatures can also lead to material deterioration.
4. Battery Cycling and Long-Term Stability
Cycle life testing evaluates:
• long-term capacity retention
• degradation rate
• Coulombic efficiency
• replacement thresholds
A typical experiment for testing a battery’s long-term stability is cycling. For this, batteries are charged and discharged several hundreds of times and the capacity is measured.
Figure 4 shows a standard cycling charge-discharge (CCD) experiment for batteries. The coin cell was first charged to 4.2 V with a 1.0 C-rate (40 mA). This potential was then potentiostatically held for at least 72 hours or if the current reached 1 mA. The battery was then discharged with a 1.0 C-rate to 2.7 V. This sequence was repeated for 100 cycles.
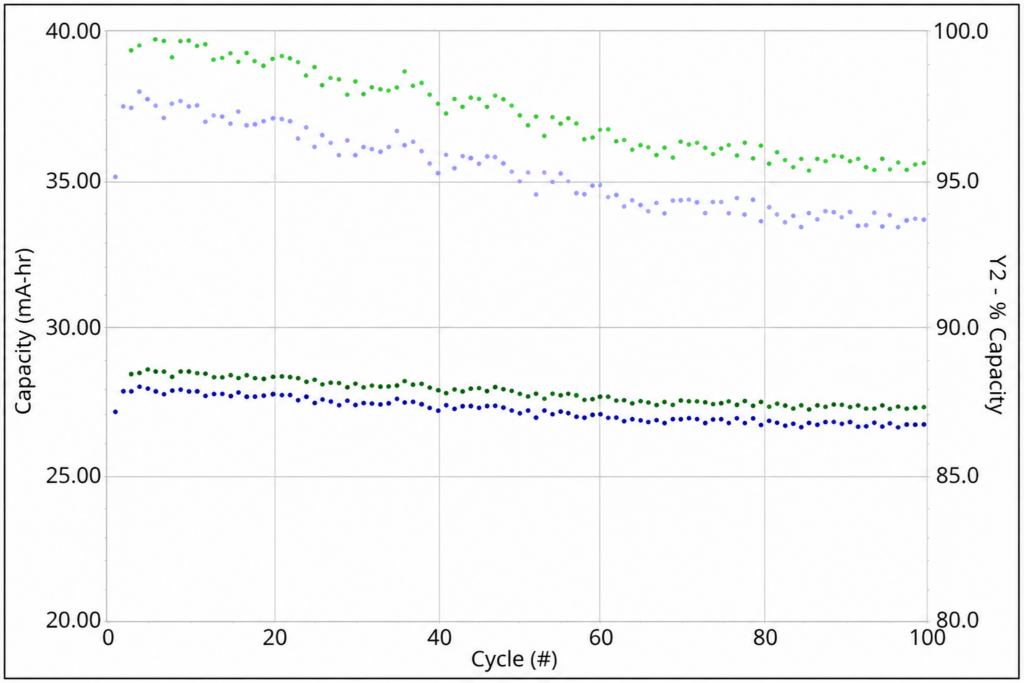
Figure 4 – CCD experiment of a coin cell over 100 cycles. charging, discharging.
The darker curves show the capacity. The lighter curves show the percentage amount of capacity in relation to the beginning. Capacity decreases only slightly after 100 cycles. The total capacity loss sums up to about 4.5 %.
5. Leakage Current and Self-Discharge
Self-discharge is caused by internal current flow called leakage current and is influenced by:
• battery age
• temperature
• storage conditions
•initial state of charge
Self-discharge is caused by interna l current flow which is called leakage current (Ileakage). The rate of self-discharge is mainly influenced by age and usage of a battery, its initial potential as well as temperature effects.
Figure 5 shows leakage current measurements on two coin cells. One battery was new and the other one was heated up to 100°C for a short time. Both batteries were initially charged to 4.2 V. The potential was then held constant and the current was measured.
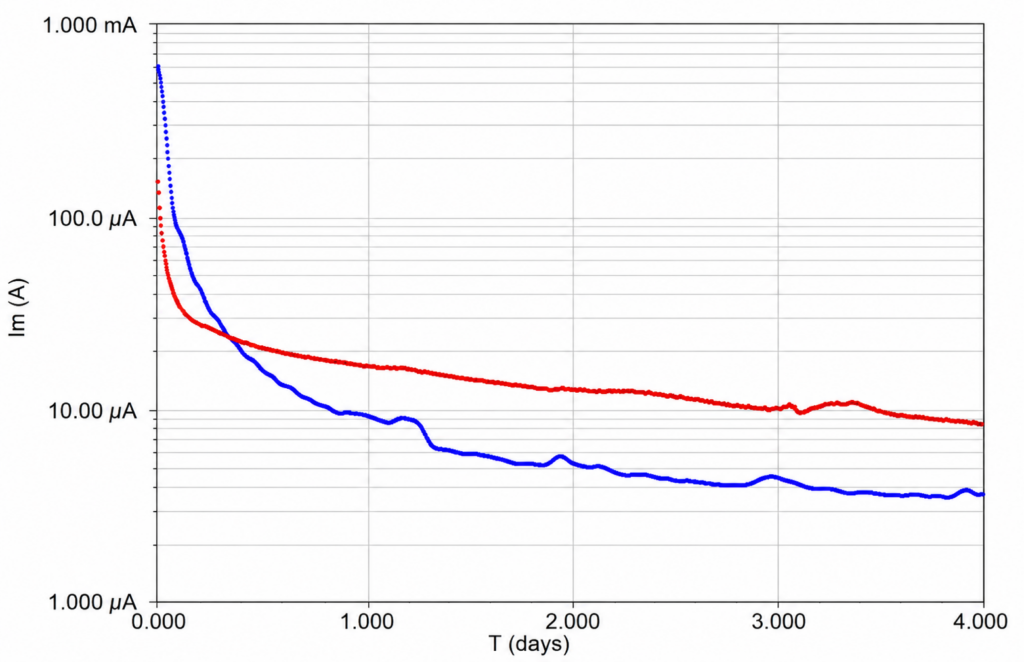
Figure 5 – Leakage current measurement on a coin cell over four days.
new battery
aged battery
In this case, leakage current is about 4.7 μA for the new battery. The aged coin cell shows with 10 μA a value which is twice as large. This demonstrates the detrimental effect of the high temperature on the leakage current.
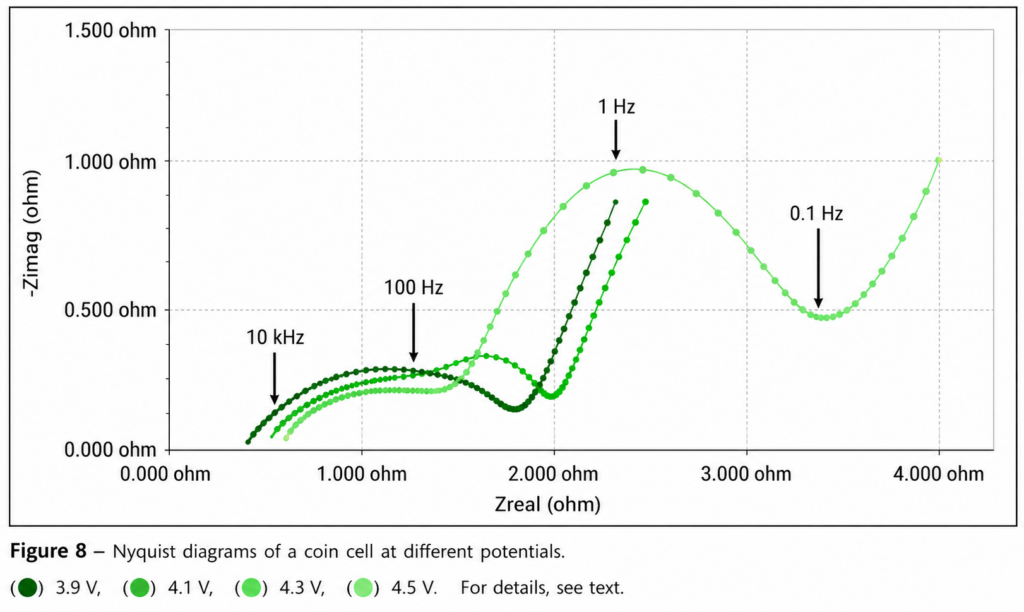
6. Electrochemical Impedance Spectroscopy (EIS)
EIS helps researchers understand:
• internal resistance
• charge transfer behavior
• diffusion limitations
• electrode interface performance
• degradation mechanisms
A full beginners guide to understanding EIS is available here:
How SciMed Supports Battery Research - What to do Next?
SciMed supplies advanced electrochemical instrumentation from Gamry Instruments, Neware, and Kolibrik to support:
• lithium-ion battery R&D
• EV battery development
• battery manufacturing QA/QC
• academic battery research
• energy storage system development
Page FAQ's
Charge/discharge testing evaluates how a lithium-ion battery performs during charging and energy delivery. It provides important information about battery capacity, voltage stability, efficiency, state of charge (SOC), depth of discharge (DOD), and internal resistance. These tests help researchers understand overall battery performance and long-term reliability.
C-rate determines how quickly a battery is charged or discharged relative to its rated capacity. Higher C-rates enable faster charging and greater power delivery, but they can also increase heat generation, voltage drop, capacity loss, and long-term battery degradation. C-rate testing helps optimise battery performance for real-world applications such as electric vehicles and energy storage systems.
Electrochemical Impedance Spectroscopy (EIS) measures how a battery responds to small AC signals across a range of frequencies. It helps researchers analyse internal resistance, charge transfer processes, diffusion effects, and electrode interface behaviour. EIS is widely used to investigate battery ageing, degradation mechanisms, and overall electrochemical performance.
- Long-term cycling tests repeatedly charge and discharge a battery to evaluate its durability and capacity retention over time. This testing helps determine cycle life, degradation rates, Coulombic efficiency, and when battery replacement may become necessary. Cycling experiments are essential for battery research, EV development, and quality control applications.
Contact Us Today
We take great pleasure in assisting you and ensuring you get a prompt response to your questions
Live chat opening hours Mon – Fri 9:15 to 16:30 (UK Time)